In our previous example, we had used FusionCharts XT to plot a chart using data stored in database. We will now extend that example itself to create a drill-down chart which can show more information.
If you recall from previous example, we were showing the sum of factory output in a pie chart as under:
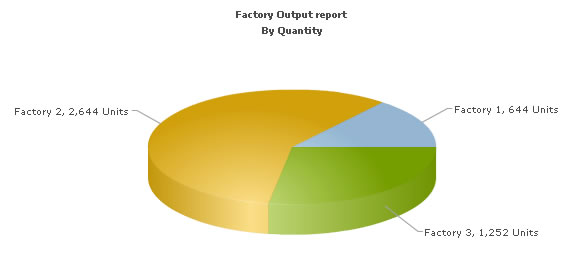
In this example, we will extend this example, so that when users click on a pie slice for a factory, they can drill down to see date wise production for that factory.
To set up the pie chart to enable links for drill-down involves just minor tweaking of our previous BasicDBExample.php. We basically need to add the link attribute for each <set> element. We create a new page Default.php from the previous page in DBExample folder with the following code changes:
<?php
      //We have included ../Includes/FusionCharts.php and ../Includes/DBConn.php, which contains
      //functions to help us easily embed the charts and connect to a database.
      include("../Includes/FusionCharts.php");
      include("../Includes/DBConn.php");
      ?>
      <HTML>
      <HEAD>
     <TITLE>	FusionCharts XT - Database and Drill-Down Example	</TITLE>
     <SCRIPT LANGUAGE="Javascript" SRC="../../FusionCharts/FusionCharts.js"></SCRIPT>
  </HEAD>
  <BODY>
  <?php
    //In this example, we show how to connect FusionCharts to a database.
   //For the sake of ease, we have used a MySQL database containing two
   //tables.
   //Connect to database
     $link = connectToDB();
    //strXML will be used to store the entire XML document generated
    //Generate the chart element
     $strXML = "<chart caption='Factory Output report' subCaption='By Quantity' pieSliceDepth='30' showBorder='1' formatNumberScale='0' numberSuffix=' Units' >";
           //Fetch all factory records
           $strQuery = "select * from Factory_Master";
           $result = mysql_query($strQuery) or die(mysql_error());
           //Iterate through each factory
           if ($result) {
              while($ors = mysql_fetch_array($result)) {
                 //Now create second query to get details for this factory
                 $strQuery = "select sum(Quantity) as TotOutput from Factory_Output where FactoryId=" . $ors['FactoryId'];
                 $result2 = mysql_query($strQuery) or die(mysql_error());
                 $ors2 = mysql_fetch_array($result2);
                 //Generate <set label='..' value='..' link='..' />
         //Note that we are setting link as Detailed.php?FactoryId=<<FactoryId>> and then URL Encoding it
                 $strXML .="<set label='" . $ors['FactoryName'] . "' value='" . $ors2['TotOutput'] . "' link='" . urlencode("Detailed.php?FactoryId=" . $ors['FactoryId']) . "'/>";
                 //free the resultset
                 mysql_free_result($result2);
              }
           }
           mysql_close($link);
           //Finally, close <chart> element
           $strXML .="</chart>";
           //Create the chart - Pie 3D Chart with data from $strXML
           echo renderChart("../../FusionCharts/Pie3D.swf", "", $strXML, "FactorySum", 600, 300, false, true);
        ?>
  </BODY>
</HTML>
As you can see in the code above, we are doing the following:
- Including the FusionCharts.js JavaScript class and FusionCharts.php , to enable easy embedding of FusionCharts XT.
- Including DBConn.php, which contains connection parameters to connect to MySQL database.
- Generating the XML data document by iterating through the recordset. We store the XML data in strXML variable. To each <set> element, we add the link attribute, which points to Detailed.php - the page that contains the chart to show details. We pass the factory id of the respective factory by appending it to the link. We finally URL Encode the link, which is a very important step.
- Finally, rendering the chart using the renderChart() method and pass strXML as dataStr.
Let's now shift our attention to Detailed.php page.
The page Detailed.php contains the following code:
<?php
     //We have included ../Includes/FusionCharts.php and ../Includes/DBConn.php, which contains
     //functions to help us easily embed the charts and connect to a database.
      include("../Includes/FusionCharts.php");
      include("../Includes/DBConn.php");
      ?>
      <HTML>
      <HEAD>
     <TITLE>	FusionCharts XT - Database and Drill-Down Example	</TITLE>
     <SCRIPT LANGUAGE="Javascript" SRC="../../FusionCharts/FusionCharts.js"></SCRIPT>
  </HEAD>
  <BODY>
  <?php
    //This page is invoked from Default.php. When the user clicks on a pie
   //slice in Default.php, the factory Id is passed to this page. We need
   //to get that factory id, get information from database and then show
   //a detailed chart.
   //First, get the factory Id
           //Request the factory Id from Querystring
           $FactoryId = $_GET['FactoryId'];
           //Connect to database
           $link = connectToDB();
           //$strXML will be used to store the entire XML document generated
           //Generate the chart element string
           $strXML = "<chart palette='2' caption='Factory " . $FactoryId . " Output ' subcaption='(In Units)' xAxisName='Date' showValues='1' labelStep='2' >";
           //Now, we get the data for that factory
           $strQuery = "select * from Factory_Output where FactoryId=" . $FactoryId;
           $result = mysql_query($strQuery) or die(mysql_error());
           //Iterate through each factory
           if ($result) {
              while($ors = mysql_fetch_array($result)) {
                 //Here, we convert date into a more readable form for set label.
                 $strXML .="<set label='" . datePart("d",$ors['DatePro']) . "/" . datePart("m",$ors['DatePro']) . "' value='" . $ors['Quantity'] . "'/>";
              }
           }
           mysql_close($link);
           //Close <chart> element
           $strXML .="</chart>";
           //Create the chart - Column 2D Chart with data from $strXML
           echo renderChart("../../FusionCharts/Column2D.swf", "", $strXML, "FactoryDetailed", 600, 300, false, true);
        ?>
  </CENTER>
  </BODY>
</HTML>
In this page, we are:
- Including FusionCharts.js JavaScript class and FusionCharts.php , to enable easy embedding of FusionCharts XT.
- Requesting the factory ID for which we have to show detailed data. This data was sent to us as querystring, as a part of pie chart link.
- We get the requisite data for this factory from database and then convert it into XML using string concatenation.
- Finally, we render a Column 2D chart using renderChart() method to show detailed data.
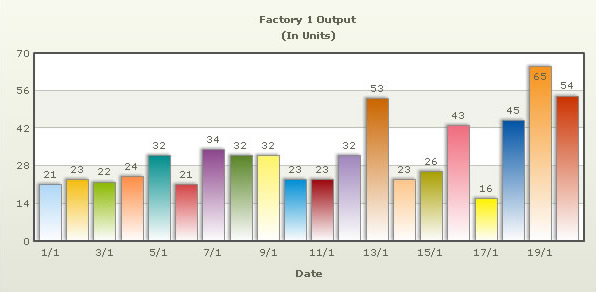
When you now run the app, you will see the detailed page as under: